Stop reading 200-page SEC 10-Ks.
Extract critical insights in seconds.
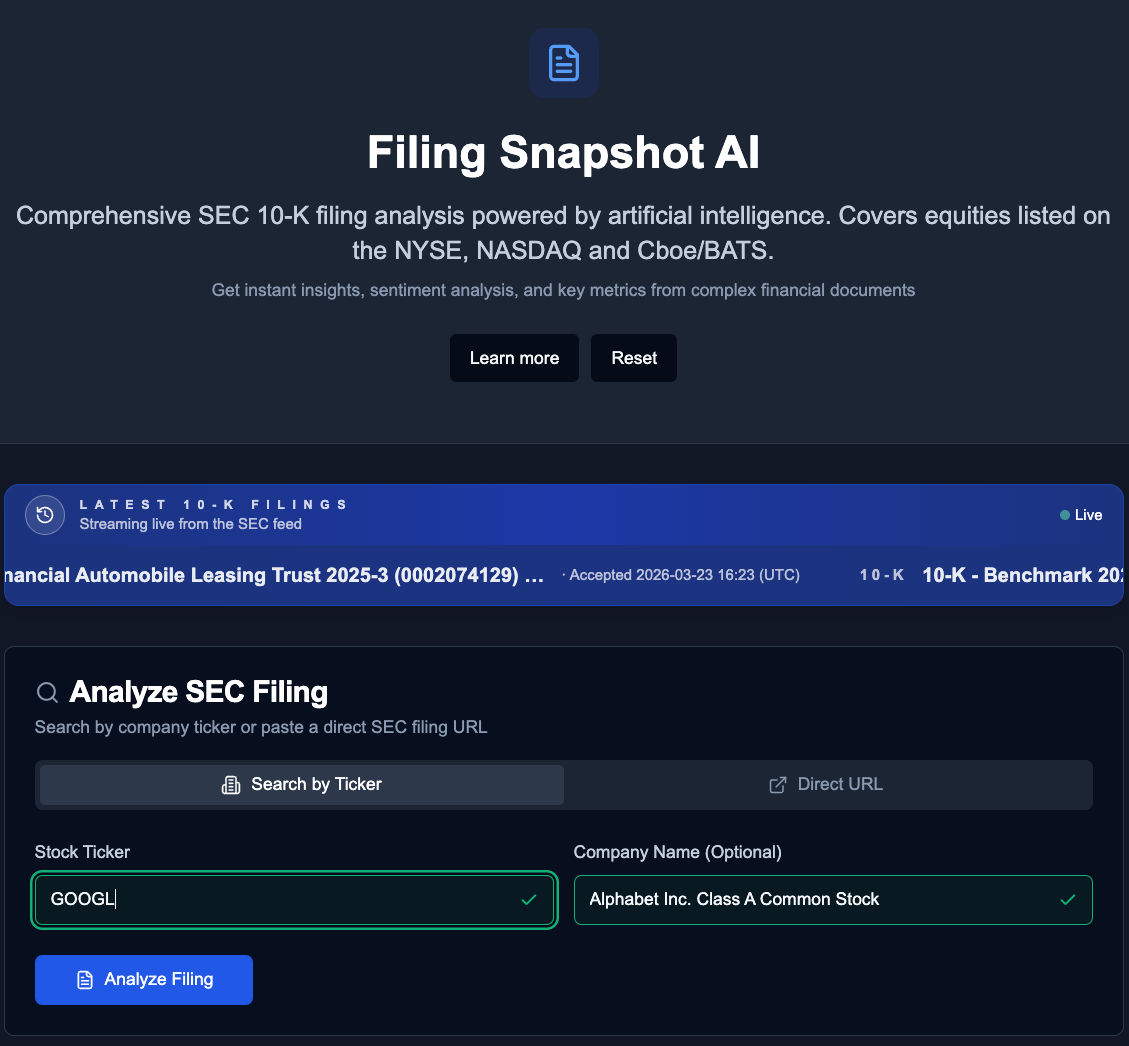
Filing Snapshot AI is your annual 10-K and 10-K/A analysis workspace powered by artificial intelligence. Get instant source-backed summaries, sentiment analysis, key metrics, and prior-year context from annual reports.
From Edgar Filing to Actionable Insights
See how we collapse hours of fundamental research and SEC filing analysis into seconds.
Search & Retrieve
Search by company ticker or paste a direct annual SEC URL. We validate that it is a 10-K or 10-K/A before analysis.
AI Extraction
Our NLP engine scans the annual filing for narrative shifts, institutional sentiment, red flags, citations, and key financial metrics.
Review Synthesis
Review an executive brief, risk register, metrics table, citations, source metadata, and prior-year comparison in one cockpit.
See 10-K Filing Analysis in Action
Watch how to move from a raw 10-K to synthesized fundamental insights — in seconds.
Instant Filing Summaries
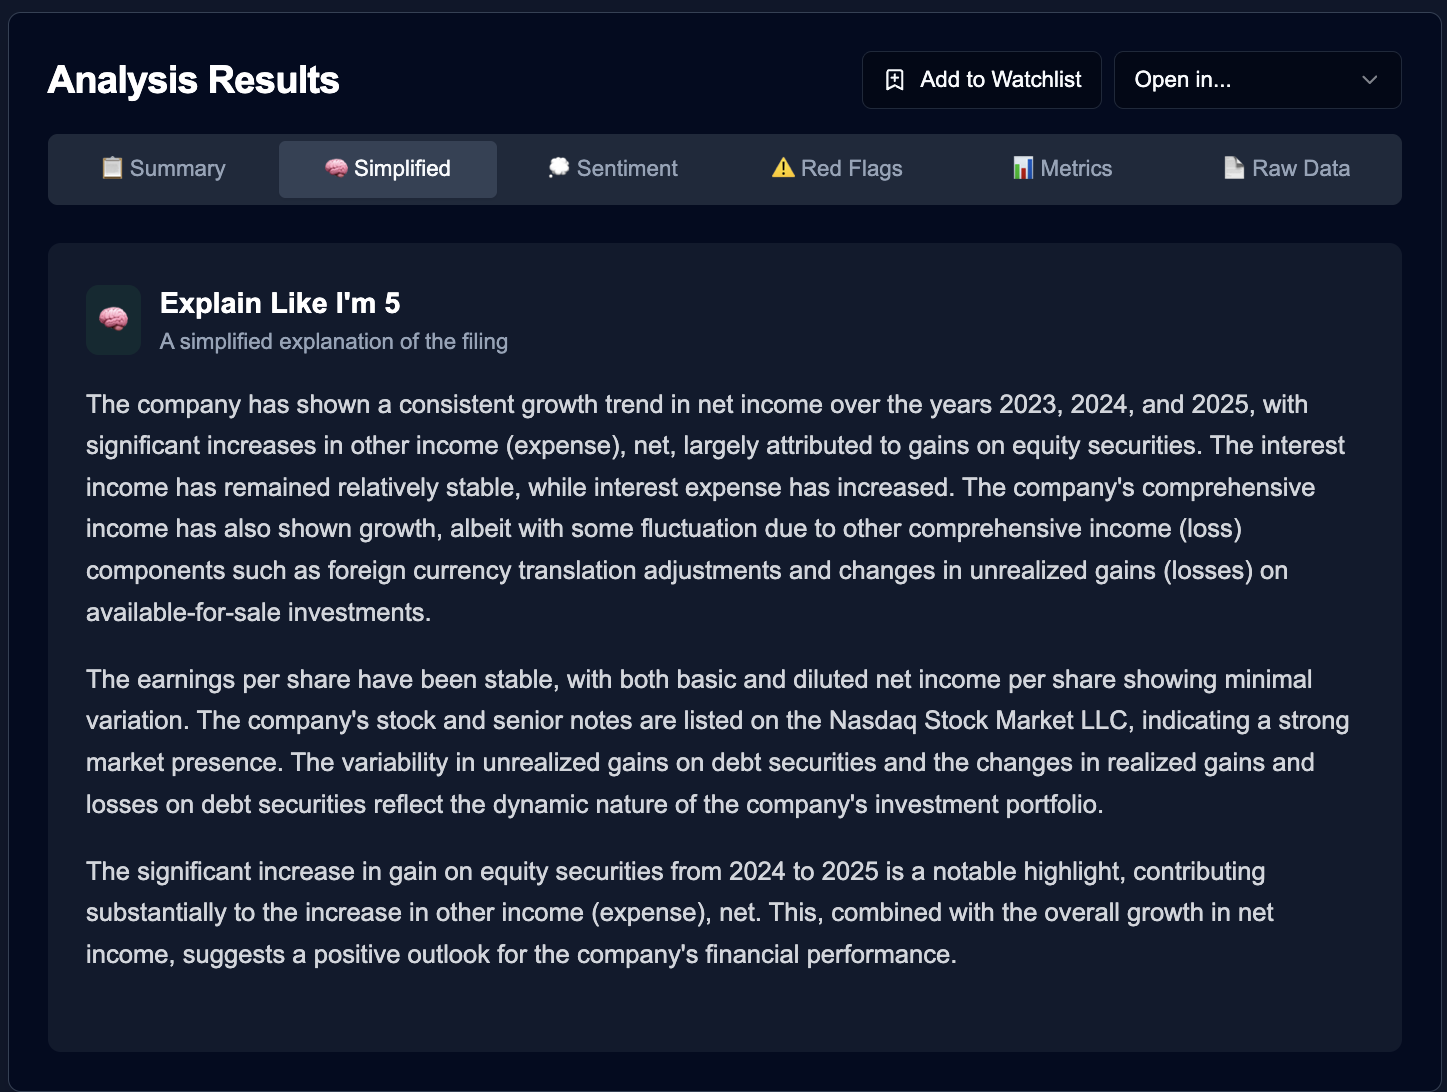
Stop scrolling through 200-page annual reports. Our NLP engine extracts and structures critical information, delivering concise summaries of operations, risk factors, and management discussions.
- Plain-English translation
- Source-backed key point extraction
- Narrative shift detection
Institutional Sentiment & Risk
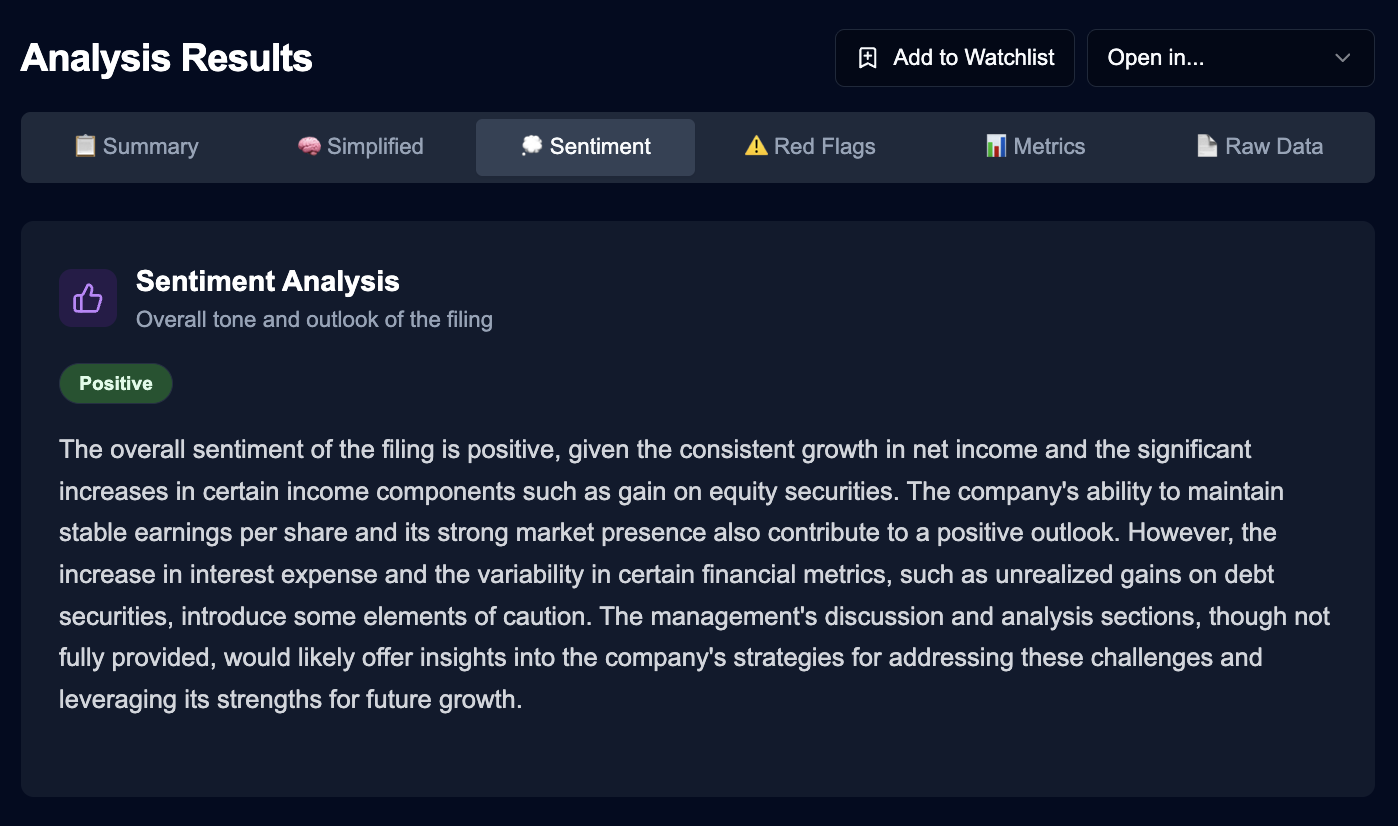
Read between the lines. We automatically analyze management's tone and detect hidden red flags, identifying subtle shifts in language that often precede major price movements.
- Overall sentiment scoring
- Hidden red flag detection
- Prior-year tone comparison
Actionable Key Metrics
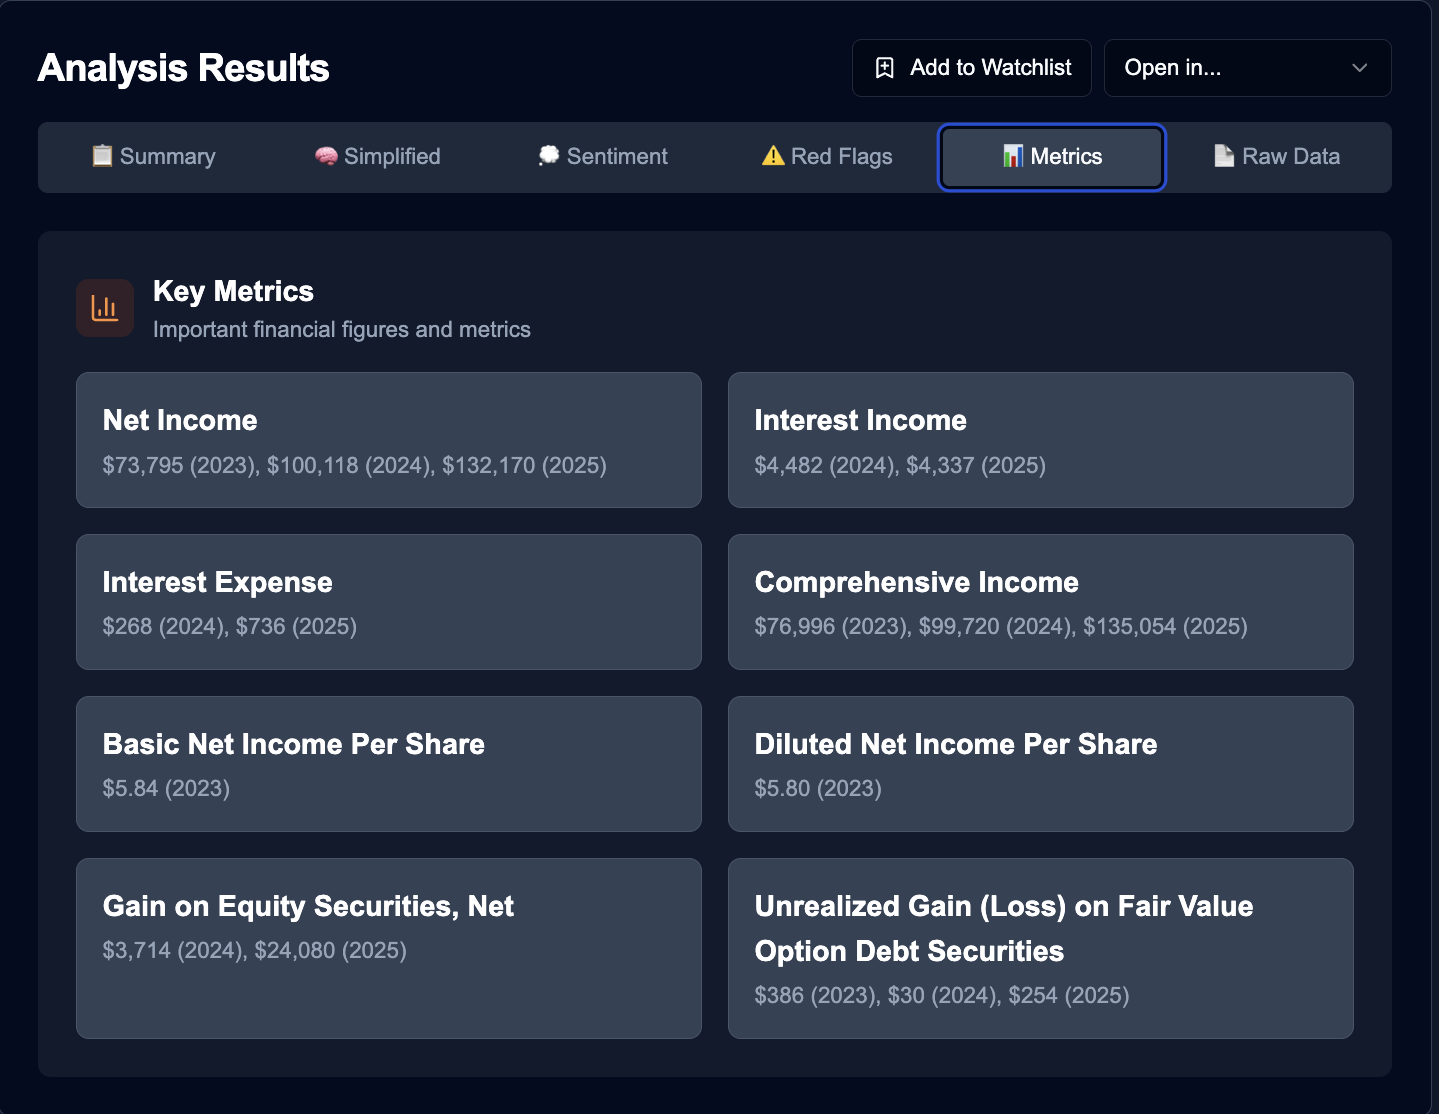
Stop hunting through dense financial tables. We instantly extract and present the most critical operational and financial figures, displaying them in a clean, comparative view.
- Metrics extracted automatically
- Prior-year comparisons
- Per-share figure analysis
Upgrade Your Workflow.
How FinMonkeys transforms your fundamental research process.
The Old Way
- Reading 200-page 10-K PDFs
- Ctrl+F searching for hidden risks
- Manually copying data into Excel
- Guessing management's true sentiment
The FinMonkeys Way
- Instant plain-English summaries
- AI automatically detects hidden red flags
- Key financial metrics displayed instantly
- Algorithmic institutional sentiment scoring
Built for Serious Market Participants
Tailored filing analysis for every style of investing.
Fundamental Analysts
Accelerate your equity research by instantly pinpointing operational shifts, analyzing management's tone, and extracting raw financial metrics.
Retail Investors
Understand complex filings easily with our "Explain Like I'm 5" summaries, bridging the gap between institutional jargon and actionable insights.
Portfolio Managers
Quickly assess hidden red flags and risk factors across multiple holdings in seconds, protecting downside via automated NLP scanning.
Trusted by analysts. Adopted by fund managers.
Join thousands of investors replacing hours of tedious filing reading with instant AI-driven fundamental insights.
Read Stories →"This tool saves me literally hours during earnings season. It instantly pulls exactly what management is saying about their future risks."
"Having key metrics instantly extracted and displayed beside the qualitative summary gives me a perfect snapshot of a company's health."
"The sentiment analysis is incredible. It flags subtle shifts in tone that are almost impossible to detect when reading a 200-page document manually."
"This tool saves me literally hours during earnings season. It instantly pulls exactly what management is saying about their future risks."
Why switch to FinMonkeys?
"I used to spend hours reading through complex 10-K PDFs just to find a few key metrics. Now it takes seconds."
"The automated sentiment and red-flag detection provides immediate insight into management's true outlook."
Common Questions
Which annual filings are supported?
This tool is dedicated to 10-K and 10-K/A annual reports for equities listed on US exchanges. Quarterly 10-Q filings belong in Quarterly Snapshot.
How does the sentiment analysis work?
Our NLP engine parses management discussion and analysis sections to score annual narrative tone, track vocabulary shifts, and flag potential hidden risks compared to the prior annual report.
Are the extracted metrics accurate?
Yes. The platform extracts direct financial figures from the filing tables and footnotes, allowing you to view and compare net income, interest expense, and per-share figures with confidence.
Does it pull data live from the SEC?
Yes, we monitor the EDGAR feed in real-time. As soon as a 10-K is accepted by the SEC, you can analyze it instantly.
Ready to step back and see the big picture?
Join thousands of investors generating instant insights with FinMonkeys.
Free plan available. No credit card required.